#223: Shiller's POV on US Stocks
Robert J. Shiller is an Economics professor at Yale University, recipient of the 2013 Nobel Memorial Prize in Economics, and perhaps most well known to traders as the inventor of the CAPE ratio (aka "Shiller PE Ratio")
Today we’ll take a look at:
What’s a PE ratio and how is the Shiller PE ratio different?
Is S&P500 currently expensive or cheap?
Price-to-Earnings
Above is how Investopedia describes the P/E ratio.
Let’s break it down:
Suppose stock xyz currently trades at $100 / share, and there are 1 million shares outstanding.
In their latest earnings report, the company reported $1 million in earnings (or net income).
Now, based on the $1 million in earnings and the fact that there are 1 million shares outstanding, this would mean that EPS, or earnings-per-share, comes down to $1 per share. (EPS: $1)
So, the P/E (Price-to-Earnings) Ratio goes:
Share Price = $100
EPS: $1
P/E ratio = 100x
How about CAPE?
The CAPE ratio stands for cyclically adjusted price-to-earnings ratio, also called the "Shiller P/E ratio"
The ratio uses actual EPS data over a 10-year period to "smooth out" fluctuations in corporate profits that occur naturally due to different business cycles, seasons, etc.
Because this ratio is cyclically adjusted and takes on average values over a long period of time (i.e. 10 years), the CAPE ratio can give insight as to whether a stock is trading at a historically high or low price relative to its earnings (or business performance)
How’s the S&P 500 looking?
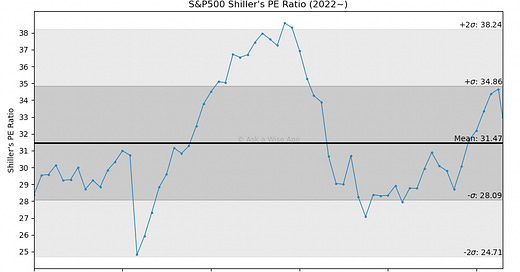
Above is a visualization of Shiller’s PE ratio for the S&P 500 index from January 2019 to April 2024 (based on our own data and data visualization models).
🧐 Looking at the past:
The huge drop seen shortly after the beginning of 2020 was when the pandemic began.
The Shiller’s PE ratio was at its recent high towards the end of 2022, when the S&P 500 index was reaching its then-all-time-high.
💡 Key takes on the currently S&P 500 level (4,967.23 as of writing):
Today, the index is back at a level higher than the end of 2022 and near yet again another time high (even after a 5% drop in the past month)
Unlike in late 2022, despite the high index, one may say that stock valuations currently are not as bloated or hypervalued as they were in late 2022.
The Fed persistently delaying rate cuts has been stressing US equities (hence the recent 5% drop), but the S&P 500 index is still trading at a Shiller's PE ratio that is on par with the average ratio (based on the past ~5 years)
IMO: For as long as the Fed continues to delay rate cuts (say, past June), there may still be room for downside in terms of the Shiller’s PE ratio.
TOGETHER WITH: BASIL (Sponsored)
“The ultimate solution for tracking and managing your investments”
☝️ Easily connect your financial accounts for multi-asset tracking, portfolio visualizations, and personalized insights.